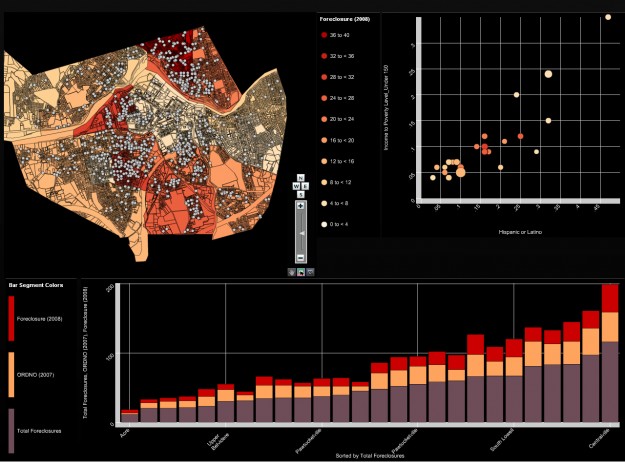
| | Weave for visualization development Feb 07, 2012 02:39 am • Permalink 
Web-based Analysis and Visualization Environment, or Weave for short, is open source software intended for flexible visualization. Weave (BETA 1.0) is a new web-based visualization platform designed to enable visualization of any available data by anyone for any purpose. Weave is an application development platform supporting multiple levels of user proficiency — novice to advanced &mdsah; as well as the ability to integrate, disseminate and visualize data at "nested" levels of geography.
It looks like everything is done through a click interface, and you can piece together modules and link them, etc. There is some setup involved, but there are a number of video tutorials and documents to get everything installed. Source code also available on GitHub. [Weave]  Members Only: How to Make a Contour Map Feb 07, 2012 01:32 am • Permalink Filled contour plots are useful for looking at density across two dimensions and are often used to visualize geographic data. It's straightforward to make them in R — once you get your data in the right format, that is.  | More to read:
| |
No comments:
Post a Comment