Glowing landscape shows river history

The poster by Daniel E. Coe shows the life-like historical flows of the Willamette River in Oregon.
This lidar-derived digital elevation model of the Willamette River displays a 50-foot elevation range, from low elevations (displayed in white) fading to higher elevations (displayed in dark blue). This visually replaces the relatively flat landscape of the valley floor with vivid historical channels, showing the dynamic movements the river has made in recent millennia. This segment of the Willamette River flows past Albany near the bottom of the image northward to the communities of Monmouth and Independence at the top. Near the center, the Luckiamute River flows into the Willamette from the left, and the Santiam River flows in from the right.
Only $15 in print. [Thanks, Larry]
Data Points: Visualization That Means Something is available now. Order your copy.
Fixing bus routes using mobile data
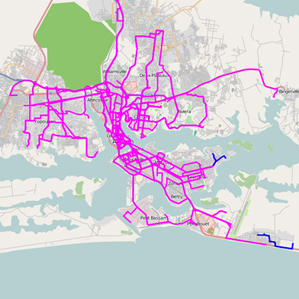 In parts of the world where there are few smartphones and GPS-enabled devices, transportation architecture has to be designed based on less granular resources, such as surveys, which can result in rough estimates. IBM researchers are looking into how data from simple cell phones can be used instead to see how people move.
The IBM work centered on Abidjan, where 539 large buses are supplemented by 5,000 mini-buses and 11,000 shared taxis. The IBM researchers studied call records from about 500,000 phones with data relevant to the commuting question...
While the data is rough—and of course not everyone on a bus has a phone or is using it—routes can be gleaned by noting the sequence of connections. And IBM and other groups have found that these mobile phone "traces" are accurate enough to serve as a guide to larger population movements for applications such as epidemiology and transportation.
[via @krees]
Data Points: Visualization That Means Something is available now. Order your copy.
No comments:
Post a Comment