FlowingData is brought to you by…
My many thanks to FlowingData sponsors who help keep the lights on around here. Check 'em out. They help you do stuff with data.
InstantAtlas — Enables information analysts and researchers to create highly-interactive online reporting solutions that combine statistics and map data to improve data visualization, enhance communication, and engage people in more informed decision making.
Tableau Software — Helps people see and understand data. Ranked by Gartner in 2011 as the world's fastest growing business intelligence company, Tableau helps anyone quickly and easily analyze, visualize and share information.
Periscopic — A socially conscious data visualization firm that specializes in using technology to help companies and organizations facilitate information transparency and public awareness. They do good with data.
Column Five Media — Whether you are a startup that is just beginning to get the word out about your product, or a Fortune 500 company looking to be more social, they can help you create exciting visual content – and then ensure that people actually see it.
Want to sponsor FlowingData? Send interest to nathan@flowingdata.com for more details.
The world as one city
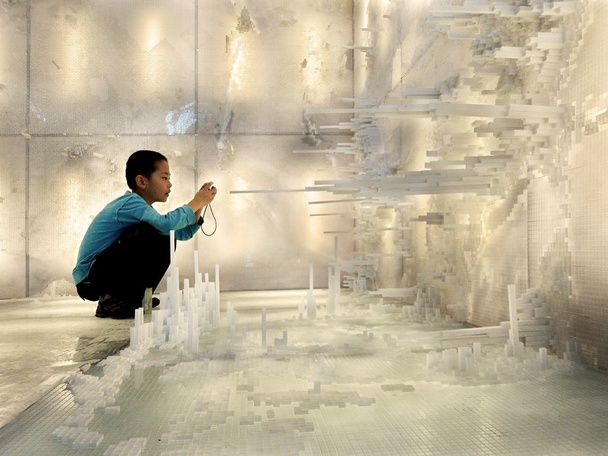
When we build models of the world, we often think of it broken down into pieces, such as cities, counties, and countries. In their newly funded project The City of 7 Billion, architects Joyce Hsiang and Bimal Mendis aim to model the world as one city, to study the impact of population growth on the environment and natural resources on a larger scale.
Every corner of the planet, they argue, is "urban" in some sense, touched by farming that feeds cities, pollution that comes out of them, industrialization that has made urban centers what they are today. So why not think of the world as a single urban entity?
Hsiang and Mendis don't yet know exactly what this will look like (that is the question, Mendis says). But they are planning to seed their geo-spatial model with worldwide data on population growth, economic and social indicators, topography, ecology and more. Ultimately, they hope, other researchers will be able to use the open-source platform for research on development patterns or air quality; the public will be able to use it to grasp the implications of building in a flood plain or implementing an energy policy; and architects will be able to use it to view the world as if it were a single project site.
Along with a slew of other challenges I am sure, one of the big ones is finding comparable data at high granularity. Large cities tend to track (and hopefully release) data about what's going, but once you step out of the major areas, data grows scarce.
They started with population, which was transformed into the physical installation above.
No comments:
Post a Comment